Welcome!

Take a look at my personal website

Timeline

  • Backend Developer at CWI Software

    Working currently at CWI Software, developing solutions for utilization of Brazil's instant payment system, Pix. The project has hundreds of microservices and coworkers and utilizes mainly Spring Boot

    Read More January, 2022
  • Analysis and Systems Development

    Concluded my Chemical Engeneering graduation and started a new Technologist course at Unisinos university

    December, 2021
  • Intern at Ambev

    Internship at the biggest beverage industry in Latin America. I learned about production process of soda, process management and control, leadership and team management, and later I develop a few tech solutions for the factory

    Read More January, 2020
  • Intern at Fepam

    Internship at a State Body responsible for the environmental licensing of enterprises. I learned about the laws concerning the rules for factories to operate, and carried out analysis of documents sent by companies, in addition to accompanying on-site inspections

    March, 2019
  • Scientific Initiation at Fepam

    Development of research on the impact of sewage discharge on the water quality of the GravataĆ­ River (Brazil).

    August, 2018
  • Scientific Initiation at UFRGS's Theoretical Chemistry Lab

    I performed Molecular Docking simulations using softwares such as AutoDock, comparing results obtained for docking of small ligands with proteins.

    March, 2017
  • Chemical Engineering

    I started a bachelor's degree in Chemical Engineering at UFRGS (Federal University of Rio Grande do Sul).

    January, 2016

Certifications

Oracle: Java SE 11 Developer

Google Cloud: Associate Cloud Engineer

Tech Skills

Click/Hover over the cards to see details

Used professionally for over a year as my main programming language

Java

Used as my main Java framework

Spring

Used to orchestrate microservices and integrate various systems

Apache Camel

Broker that allows to publish and receive messages for assynchronous services. Used integrated with Spring.

Rabbit MQ

Used in my internship projects, and also in frontend projects

JavaScript

Used to facilitate backend integration in frontend projects, defining classes and interfaces

TypeScript

Used mainly in my Final Paper project and some data science projects

See use case

Python

Used as the main backend testing framework in my current job

Karate

Used in my internship projects

See use case

NodeRed

Used to generate images of microservices

Docker

Used daily to perform all necessary operations for team development

Git

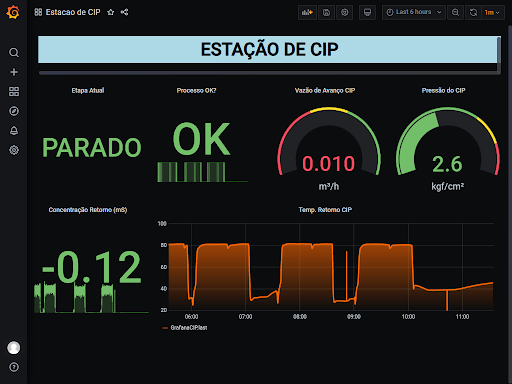
Used in my internship project and also in my current job to analyze services/pods health

See use case

Grafana

Used to develop APIs following the contract-first paradigm

Open API

Used to provide easy documentation to the APIs available in a service

Swagger

Used as hobby to draw sketches

See sketches

p5.js

Used as hobby to draw sketches

See sketches

Processing

Used in my internship projects to create intuitive dashboards

See use case

Power BI

Used in my internship project to create a Proof of Concept application

See use case

Power Apps

Used as the main frontend framework and also in some personal projects

Angular

Used in my personal projects

React

Used to create some applications that don't require frameworks, like this portfolio site

Html/CSS

My most used database, used in current job and also personal projects

SQL Server

Used in my internship projects and also personal projects

MySql

Used in my internship to store time-series data

See use case

InfluxDB

Used in my current job and personal projects to provide an easy-to-use interface with databases

JDBI

Microservices

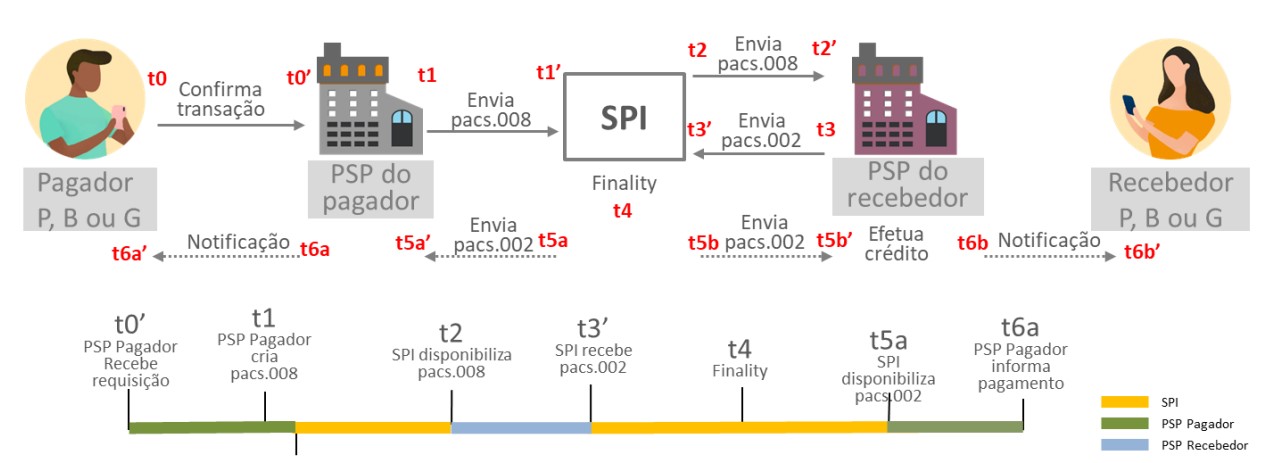
Currently I work at a Bank, developing mainly backend solutions for Brazil's instant payment system, also kwown as Pix. Basically, transactions between different banks pass through the Central Bank, which regulates and defines the APIs that banks should use to make Pix transactions.


First, the debtor participant sends a message to the Central Bank stating the desire to initiate a transaction. Then, the Central Bank sends a message to the creditor participant, informing about the payment request. If the receiving bank accepts the payment, he answer with another message to Central Bank, which then notifies both the participants about the success of the transaction.

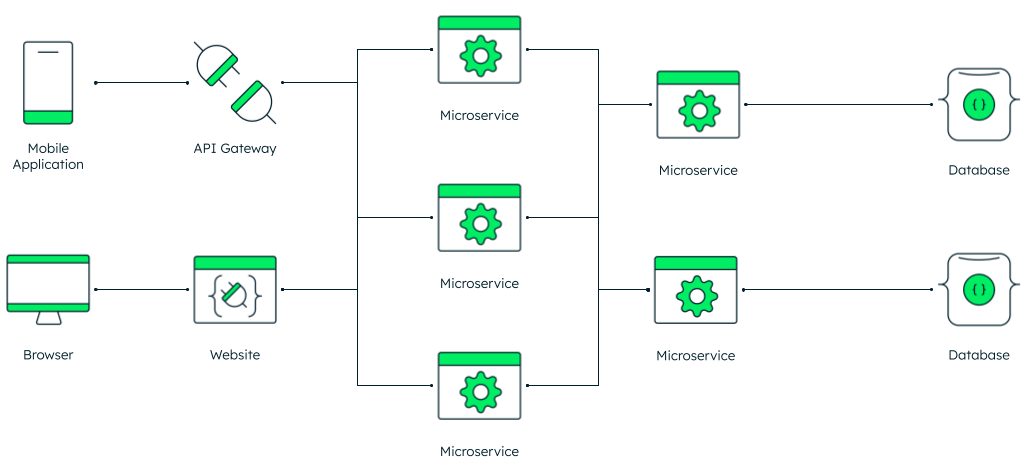
The project utilizes microservices architecture, dividing the components as Orchestrators (Integration microservices) and Atomic microservices. Orchestrators handle the integration and routing business logic, making the necessary calls to the atomic components, and listening/posting to MQ queues. Atomics handle the database connection, saving and retrieving data, among other more specific tasks.

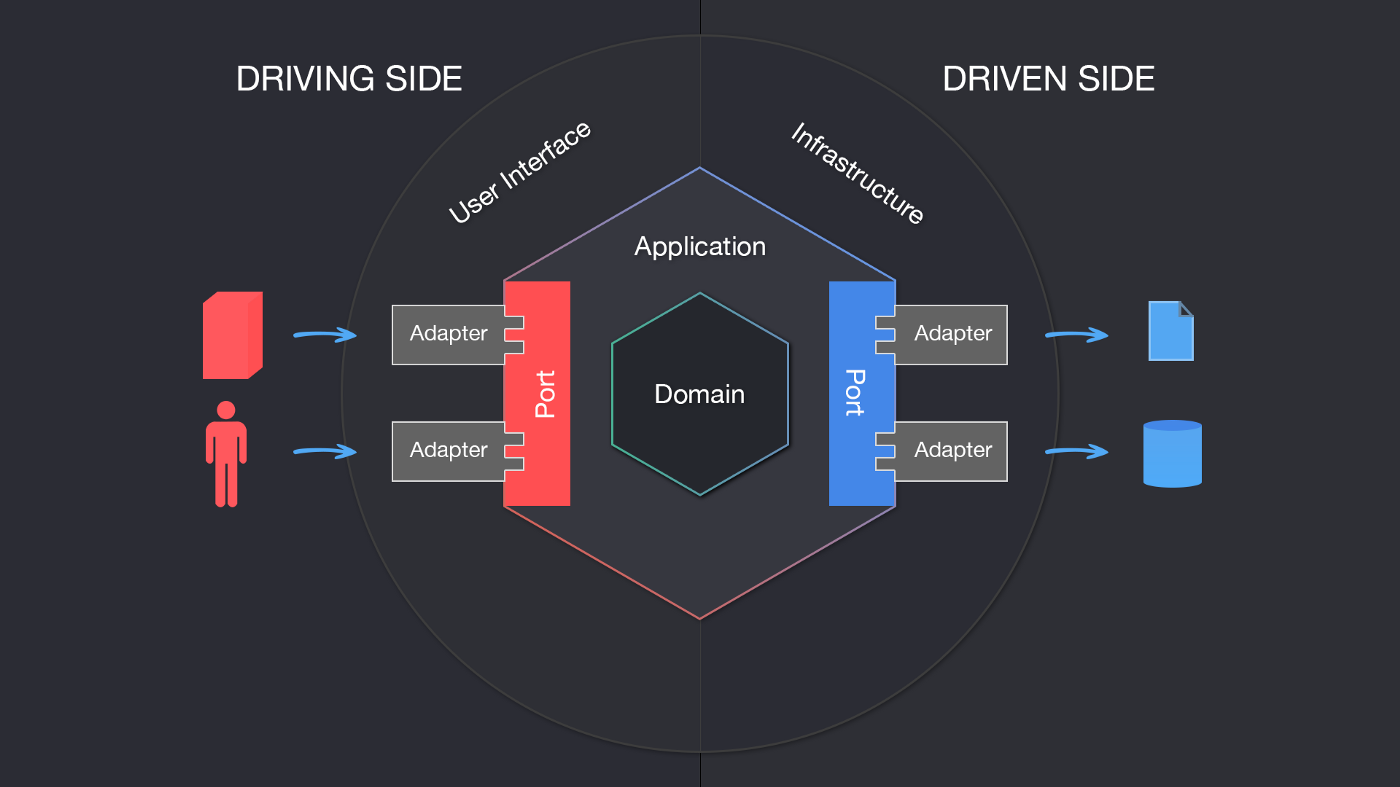
Every component is implemented following the Hexagonal (Ports and Adapters) pattern, which focus on segregating as much as possible the Application layer from the Domain (business logic) layer. The main goal is to prevent coupling and dependency between services, providing an easy way to connected to their software environment by means of ports and adapters. For instance, if it were necessary to change the DBMS, this could be done by making changes only to the adapter layer, without changing the other layers.


Automation with NodeRed

During my internship at a soda factory, I started to learn about process Automation and control. The factory had a lot of equipments which weren't connected to any external network, only the OT network, so the data acquired was not storaged. From that, the Automation team began to study ways to access and store data aiming to improve the process control management. We utilized NodeRed, which is a programming tool for wiring together hardware devices, APIs and online services. NodeRed is built on Node.js, and offers a browser-based flow editor, allowing to write flows mixing JavaScript code and custom nodes. There are many libraries of nodes available, providing an easy way to connect with multiple interfaces. The image below shows how one of the created flows looked like.
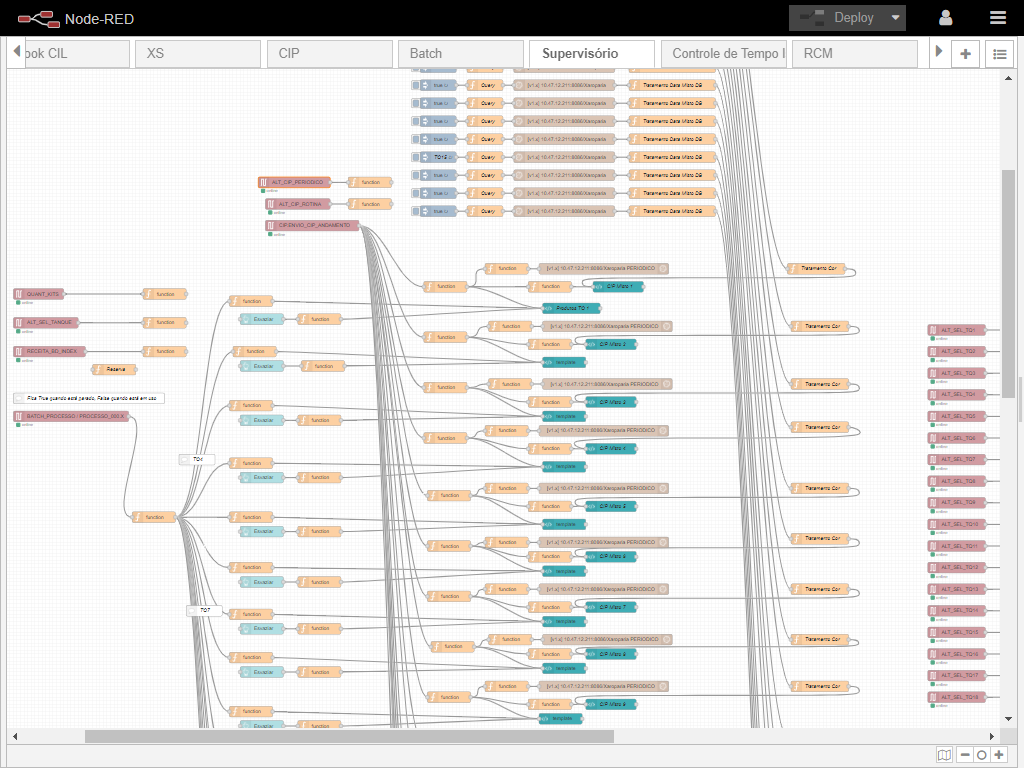
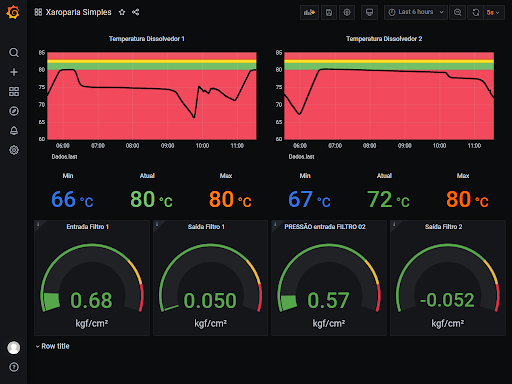
The first step access the data is the Ethernet/IP node, responsible to connect with the PLC and access the internal variables to read their values. There is also specific nodes to interface with Allen Bradley/Rockwell or Siemmens PLCs. After that, we could save the values to a database. We utilized the InfluxDB node, due to it's simplicity and focus on storing time-series data. After storing, dashboards were built with Graphana to monitor in real time the behaviour of variables such as pressure, temperature and concentration.
In addition to continous data, we read boolean variables from the PLCs, indicating if some valve was on/off, if some process was ocurring or not, and also discrete numbers which represented which tank was selected, what recipe and what volume would be produced, since the production was controlled using a Human Machine Interface (HMI). For that type of variable we opted for a relational database, MySql. NodeRed also provides a built-in tool to create dashboards, called NodeRed UI. We created some UIs to show which tanks were filled with what product, the volume produced, and the date of production. This helped to manage production without relying on book annotations.
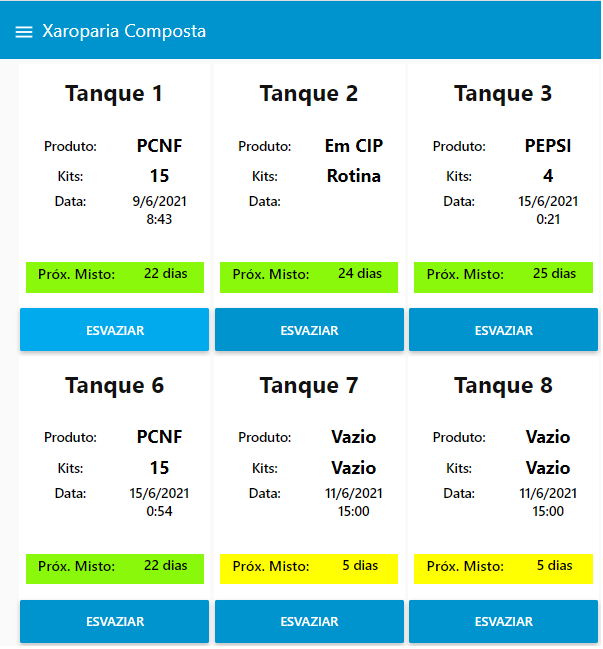
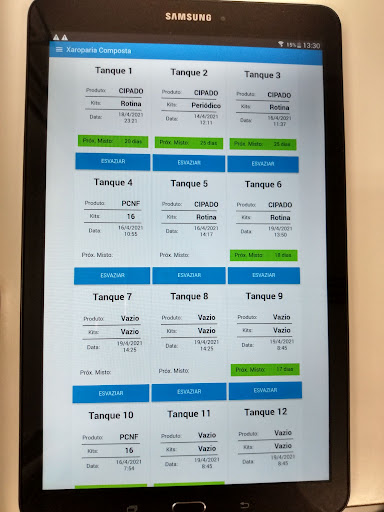
It was also possible to better manage Cleaning in Place (CIP) routine, which is the process of cleaning the tanks from the inside, circulating chemical products such as caustic soda, each one during a certain amount of time and temperature. The CIP process has a determined frequency to be done. Since the process of doing the CIP was controlled by the PLC, we could access the variable that stored which tank was selected to be cleaned, and store the number and current date. The Dashboard then calculates how many days are left untill the next mandatory CIP, and that number is presented with different background colors to indicate how much time is left (green parts of the image above). During the CIP process there are many programmed stages to occur, each stage represented by a variable, so we also calculated the time spent at each stage to assess the quality of the process and find improvement opportunities.

Finally, we connected a TV to the OT network to display the dashboards in the control rooms, and we could also use Tablets to access the network via WiFi. This project was part of a new phase of automation at the factory, and once again I could see the difference it made in people's routine, making data collection and analysis faster, more accurate and more reliable.


Low Code with Power Apps and Power Bi

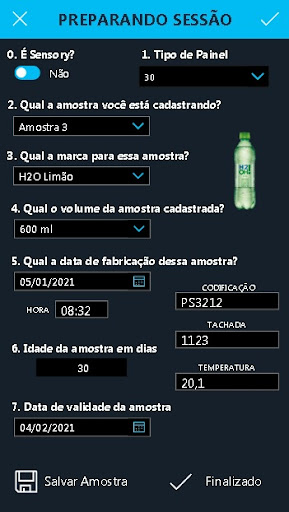
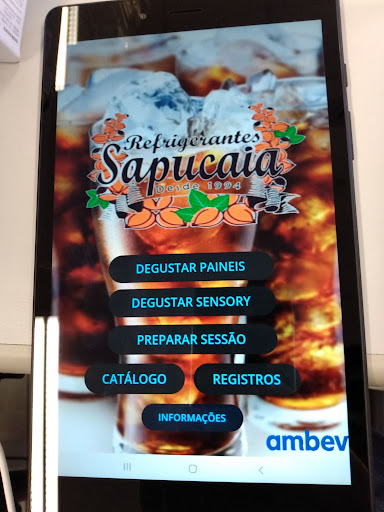
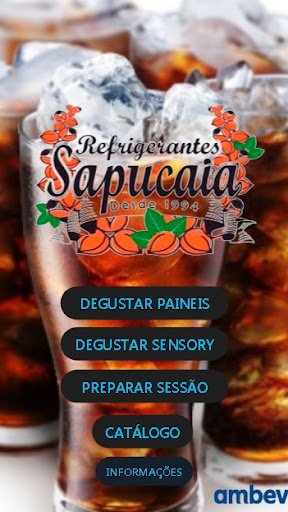
Also during my internship, I develop an App using the Low-Code platform Power Apps, maintained by Microsoft. The goal was to test a prothotype and see if people would like to use it. Since I worked at a soda factory, the App was designed to manage the tasting sections made for quality assurance of the product. The process consists of tasting some samples of the week's production, which were previously collected and arranged in a laboratory for trained and qualified employees to taste. Each employee gives a rating for each sample and makes observations about the strengths and weaknesses of the samples. All notes were made on paper, and later transcribed to Excel.


The App focused on making this process more agile. First, the employee in charge of the laboratory created a "tasting section", which represent the collection of samples to be analized at that session. Each section had it's own number of samples, and each sample had it's own information, such as bottle size, expiry date, temperature, brand, and batch number. After creating the section, the tasters were able to access it in their cellphones and avaliate each sample, giving a score, and giving notes about the intensity of flavors. Besides, the App had a little section to see the avalitions of the latest section, and another section to see the expected characteristics of each brand.
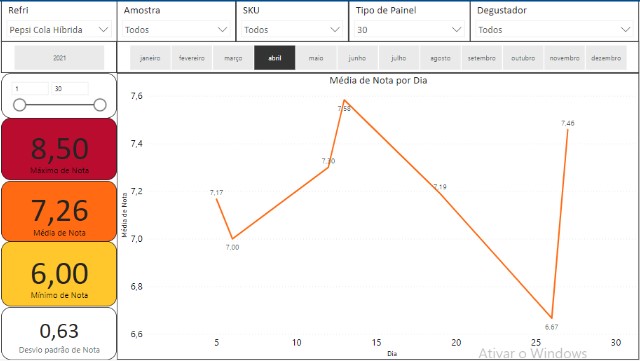
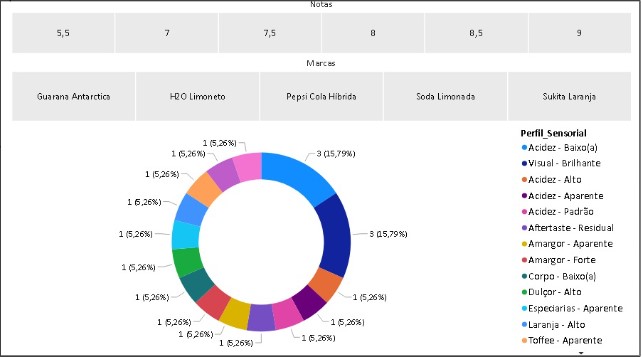
After all the tasters had tasted and avaliated their samples, the data was sent to a Sharepoint List, which was used to storage all data. We also created an integration between Sharepoint and a Power Bi Dashboard. The metrics calculated by the dashbaord were used in meetings and discusions about improvement points for the product, mainly focusing in understanding what causes the lowest scores. We could filter by date, flavors, worst ratings, and others.

The App was develop in about 2 weeks, and the first adjustments were made very quickly. I partnered up with the laboratory responsible, who knew the business and taught me, and I proposed to him how the App could be develop. It was a great experience, because I could see the difference that it made in the laboratory routine, and I enjoyed transcribing the business logic into a new solution. The project was awarded as one of the best internship projects among Latin America factories, and later the development of an official, more scalable and robust solution was started.


Python and Image Processing

As my final paper, I conducted a research investigating the possibility of using a Raspberry Pi to perform an automatic inspection of the quality of expiration date on bottles. This idea came during my internship, where I saw the importance of this inspection on the production line. The equipment which does the inspection verifies every bottle, assuring that the expiry date is present, although, it doesn't verify if it's readable (not blurried) or incorrect.

My project utilized a domestic treadmill to simulate an industrial conveyor belt. The sample bottles were placed manually at the start of the treadmill. At the end was placed a Raspberry Pi, combined with an infrared sensor to detect the bottles, and a RaspCamera V2 to capture the images.

After the capture, a Python script processed the digital images using libraries such as OpenCV to manipulate the image and enhance quality for the proposed goal, performing operations such as Sharpen, Background Removal, Denoise, Adaptive Threshold, Dilate, Deskew, and others, ending with an OCR operation to extract the text of the expiry date region of the bottle. The set of captured images was used to test image processing methods. Different techniques and sequences were tested until the final combination was determined.

The extracted text was then avaliated as correct/incorrect using Regex Expressions, according to the possible patterns of each bottle tested. For instance, if a bottle has fixed letters/digits in certain positions, these fixed characters must be found. If it has 4 digits in a certain position, then 4 random digits must be found, but not letters.


Finally, I started to integrate the "Capturing image" algorithm with the "Processing image" one. Since the methods utilized in the images required more computational capacity then Raspberry Pi could provide, I utilized Web Sockets to comunicate between the Raspberry (client) and my PC (server), sending the captured images to the PC while the Raspberry waited the response. After receiving the conclusion of the analysis for that sample (OK/NOK), the whole process starts again and continues on loop. Here are some of the techniques utilized to process the images.


Sharpen

Threshold Binarization

Background Removal

Denoise

Dilation

Deskew

Arc Distortion


After graduation, my mentor during the research helped me to find an adequate journal to publish our work, and we submitted an article to the international publisher Digital Manufacturing Technology, which was accepted. The article is available here. The final paper is available at the digital repository of my University, here.


Web Development

College Enrollment

A project developed to be a university enrollment system, where it is possible to register new users with Student or Teacher profiles. Teachers are directed to a screen where they can register the subjects offered, filling in name, day of week, time, among others. Teachers can register, edit and delete the subjects they own. Students can view a list of subjects offered by all teachers, and select the ones they wish to enroll in. A timetable is filled in when selecting subjects. Some rules implemented include the prohibition of time conflicts and control of the maximum number of students per subject. Made with React and Firebase for Authentication and Realtime Database (NoSQL).

Github

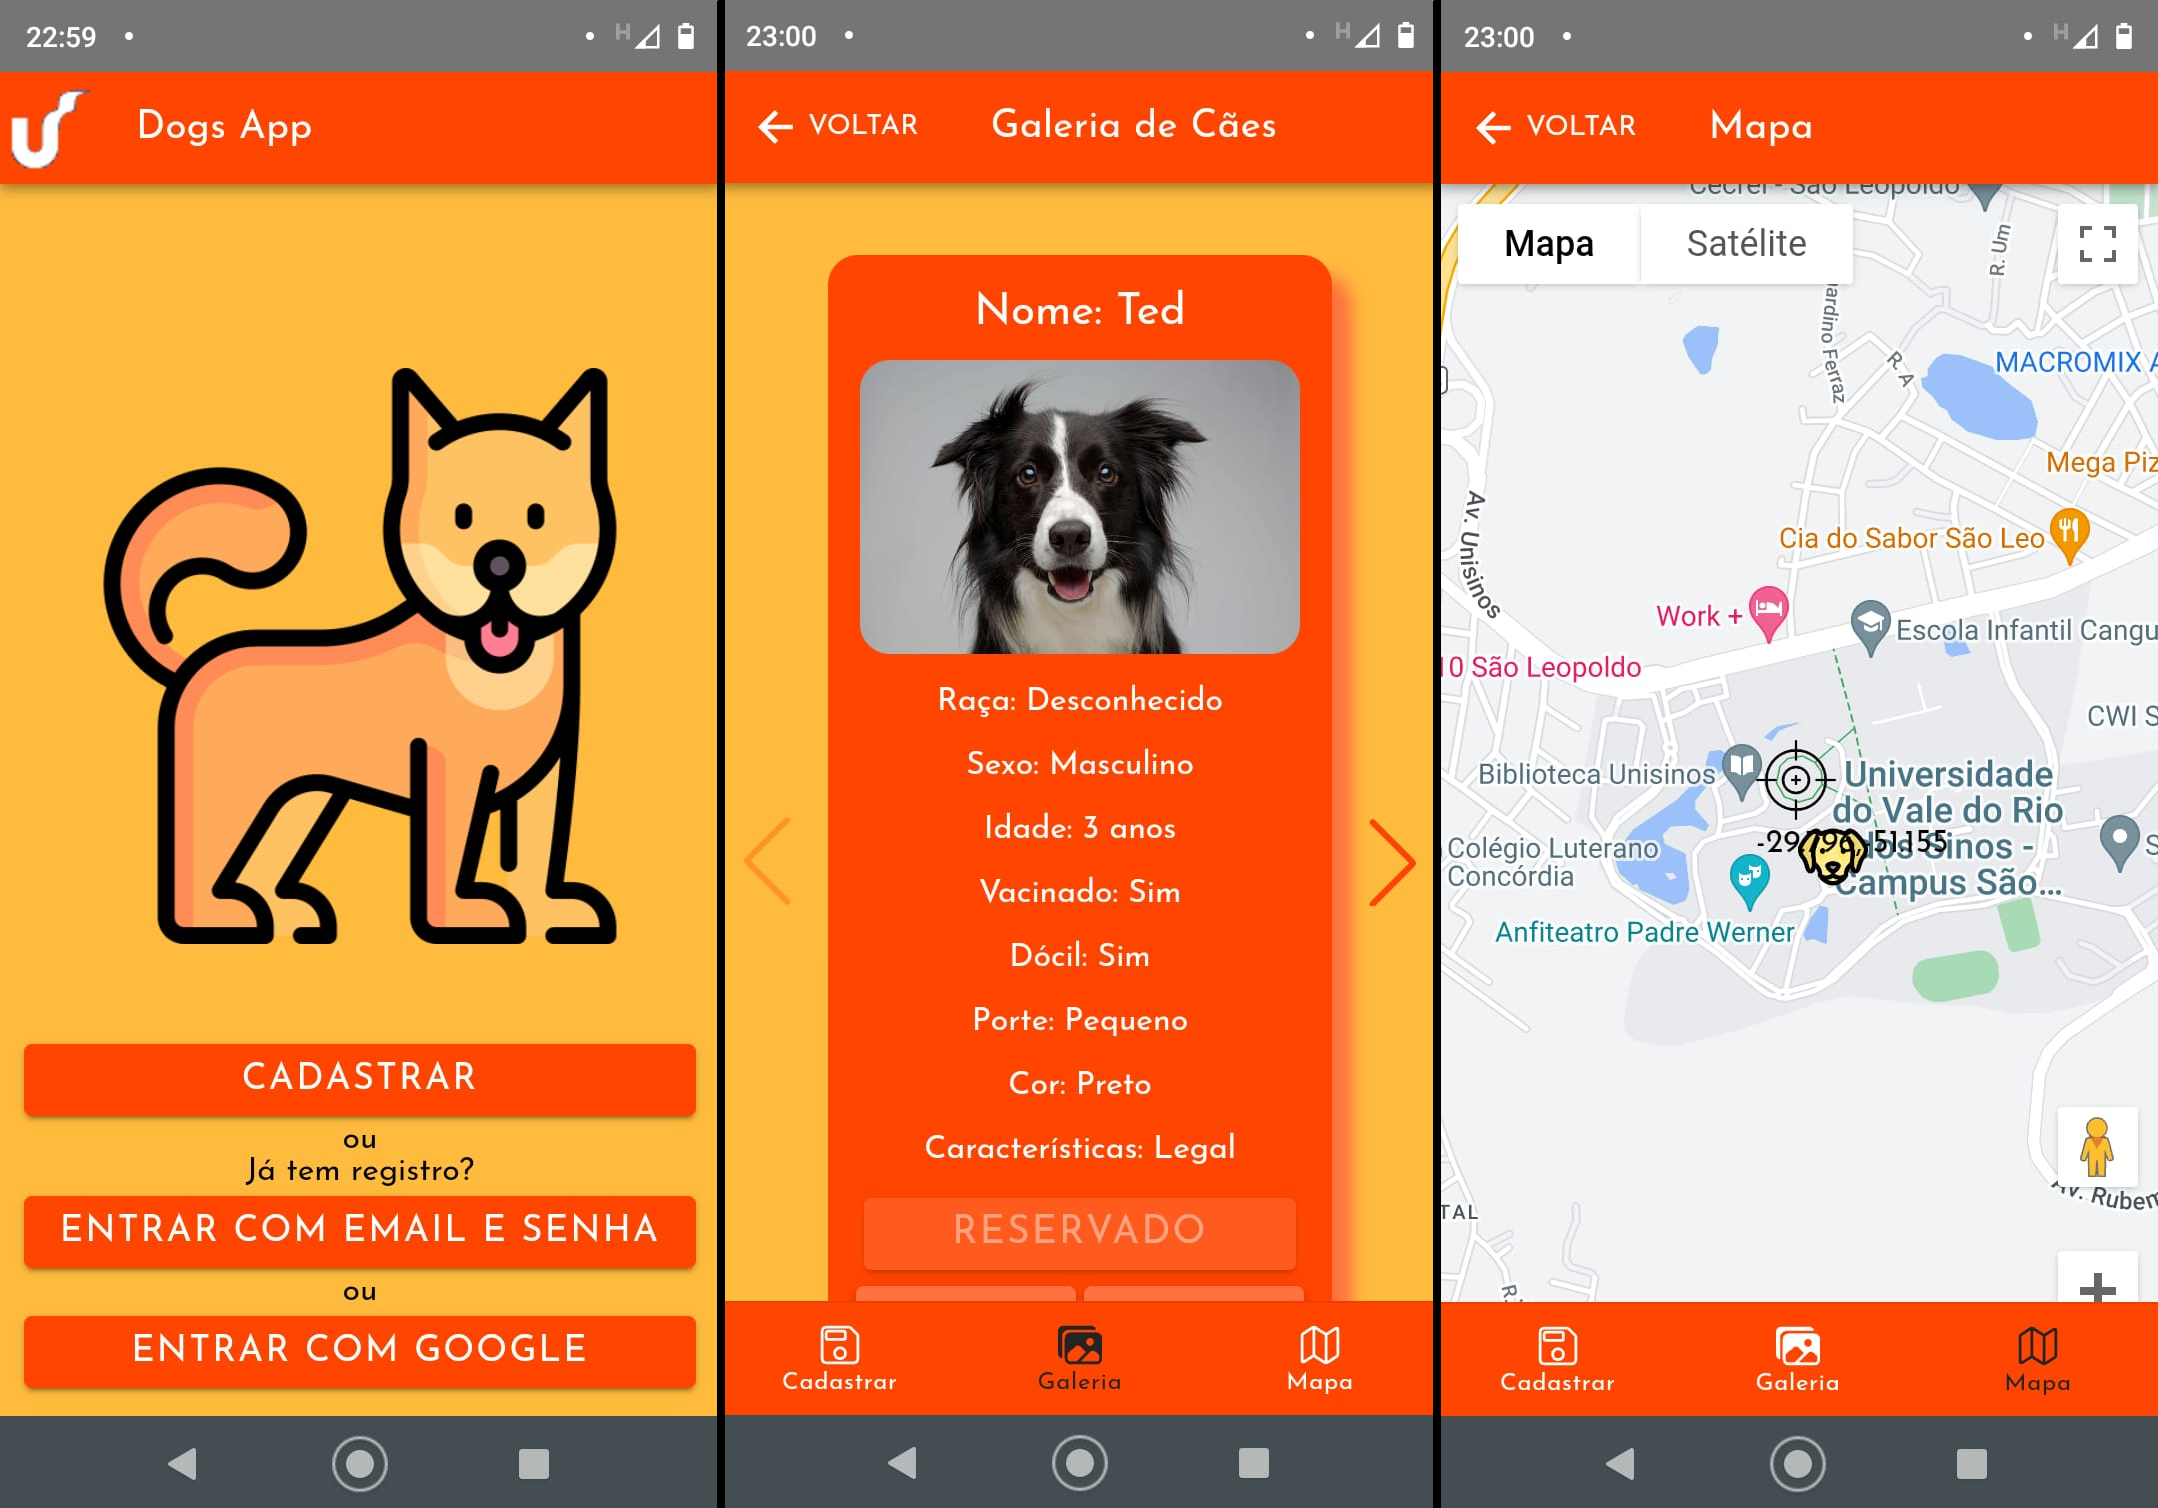
Dogs App

The app was develop mainly for mobile use, but can also be acessed in browsers. The application aims to serve as a social solution to the problem of abandoned dogs, providing a simpler way of adoption. The app's administrators could be employees of kennels or non-profit organizations that take care of dogs for adoption. Admins can register dogs, upload photos, fill out basic information, and adopters can view the dog gallery and schedule an adoption visit. When scheduling the interview, the chosen dog is locked for other users until the visit takes place and the adopter decides whether to adopt it or not. In the first case, the admin confirms the adoption and removes the dog from the gallery. In the latter, the admin releases the lock and makes the dog available for adoption again. Made with Angular + Ionic (Mobile SDK for Web Development), and Firebase for Authentication and Realtime Database (NoSQL).

Github

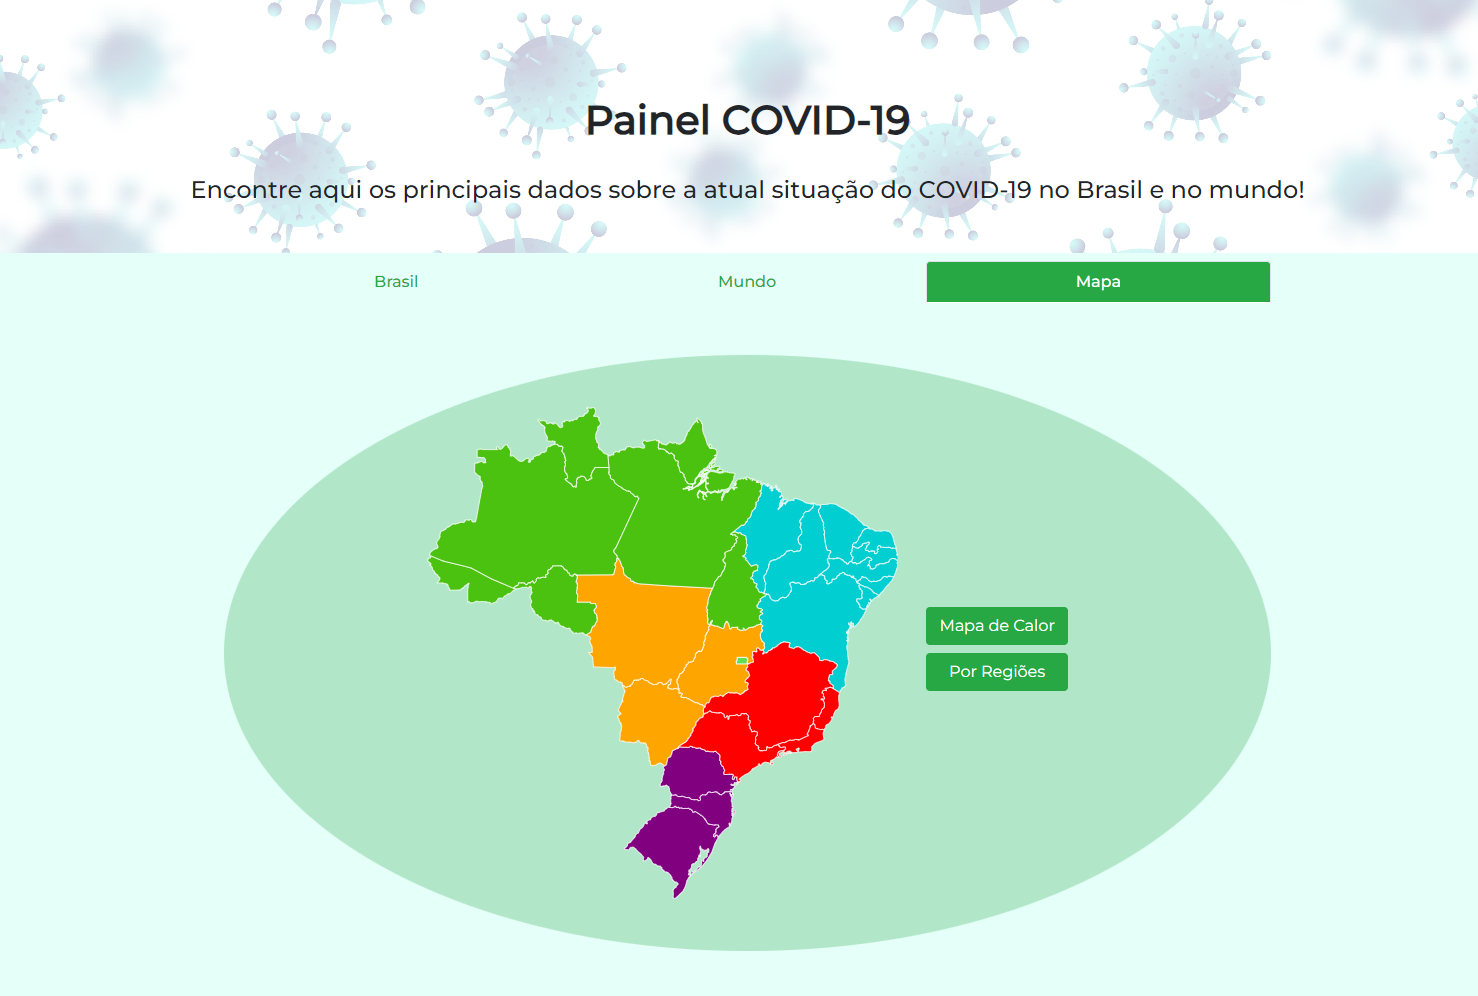
COVID-19 Panel

A simple project develop using a public API for obtaining COVID-19 data. The website has 3 tabs, the first one allows the user to see information of COVID-19 impact on Brazil, filtering for state and date period. The second one, shows world data separated in countries, and the last one presents a interactive map of Brazil, separated in regions, where the user can see information about each state on hover. It also has a "Heatmap" option, which colorize the map in a scale according to the number of Covid cases in each state, ranging from light-green to dark-green. The website was built using jQuery and Bootstrap along with regular Html/CSS/JS, and it's available here.

Github

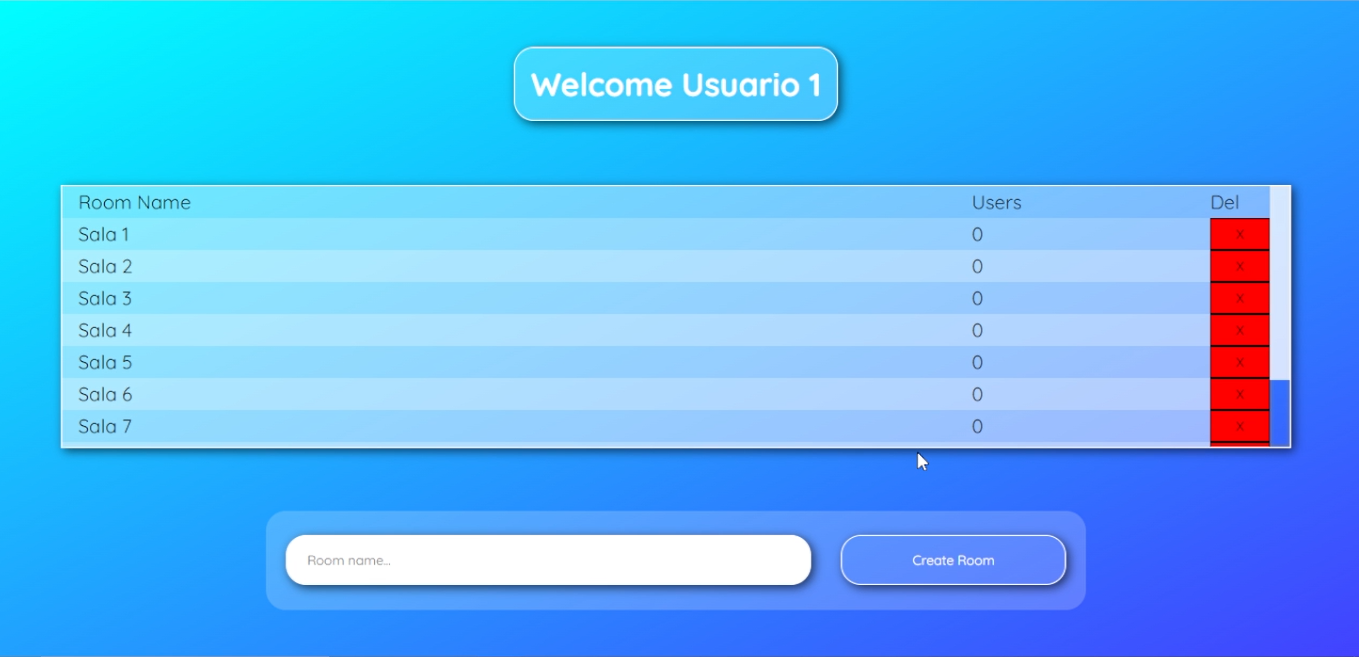
Socket Rooms

When you open the app, you need to choose a temporary username. Then you will see a list of all existing rooms and the number of users in each room. It is allowed to create new rooms and delete rooms that are empty. Inside a room, it is possible to send messages, view the messages sent before the user joined, and each message presents the name of the person who sent it, its content and date of sending. The messages are delivered to all users in that room, in real time. The creation and exclusion of rooms also happens in real time to the user. Made with Angular, Node.js, Prisma ORM, Sockets.io and SQLite.

Github

Wordle

An implementation of the Wordle game, but with an extra feature: the 'Get Tips' button. Based on the word attempts made, the API suggests what words are possible answers according to the wrong/right letters. There's also a "Statistics" page to see how many games you played, and a graph of your victories by attempts. Made with Spring, OpenAPI, PostgreSQL, JDBI, and Angular. Uses Docker to generate images and has a docker-compose file to manage all the containers.

Github

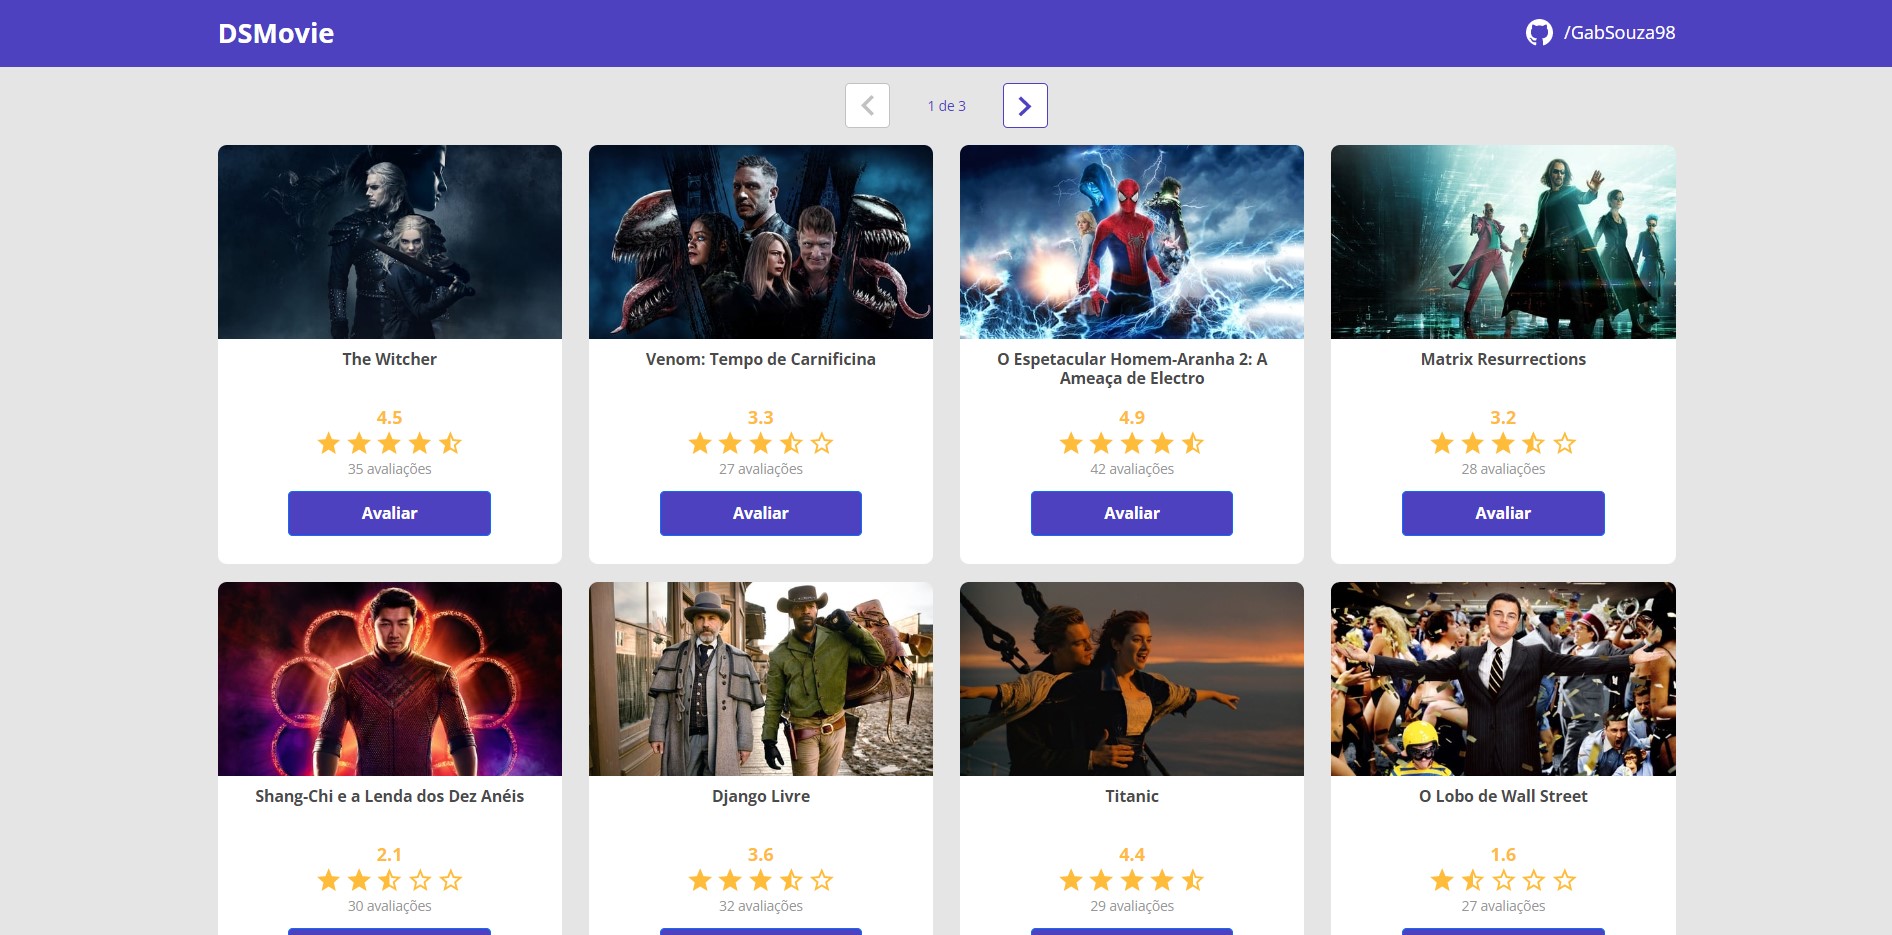
Movie Ranking

The app allows users to rate movies from 1-5 stars, displaying the average score of each movie and the amount of avaliations. If the same user avaliates the same movie more than one time, the API considers as an update, maintaining the amount of avaliations and calculating the new average score with the new rating. Made with Spring, JPA, PostgreSQL and React.

Github

Sales Dashboard

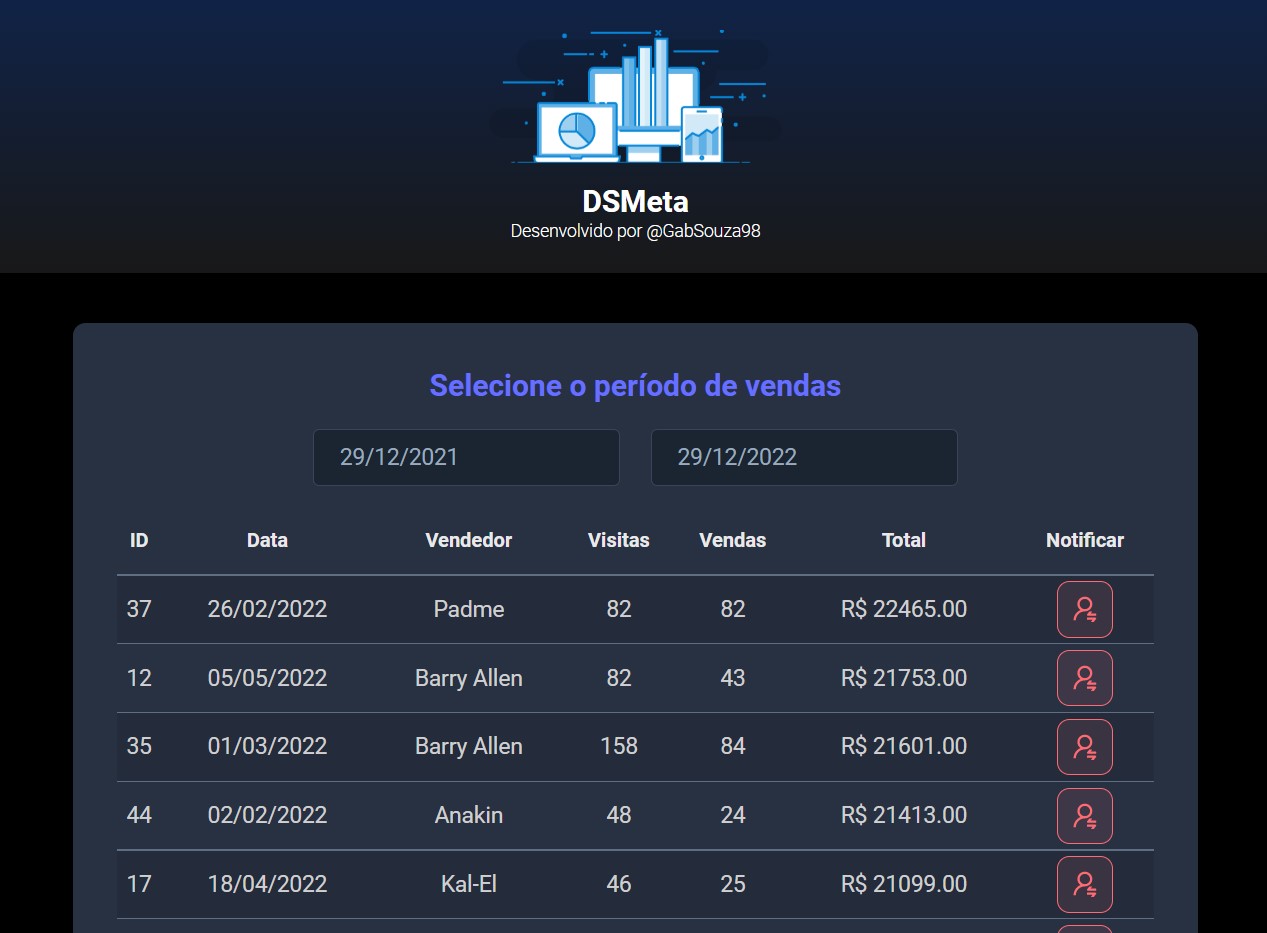
The app shows a list of sales by employee, allowing you to filter by date. There's an integration with Twillio's API to send a SMS to the employee's registered phone. Made with Spring, JPA, PostgreSQL and React.

Github

Games and Animations

P5 and Processing animations and games.

Made with p5.js

Full version

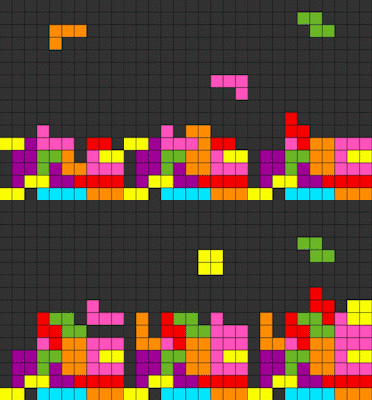
Tetris

Made with p5.js

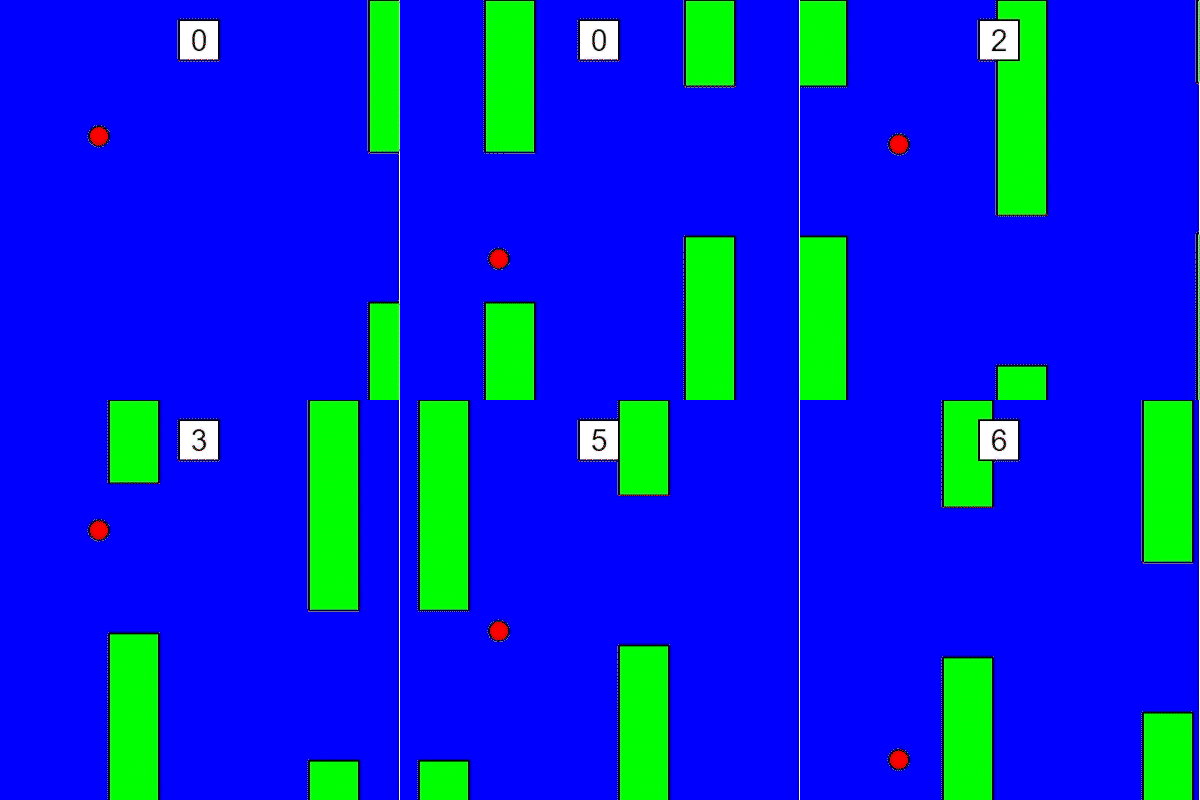
Flappy Bird

Made with p5.js

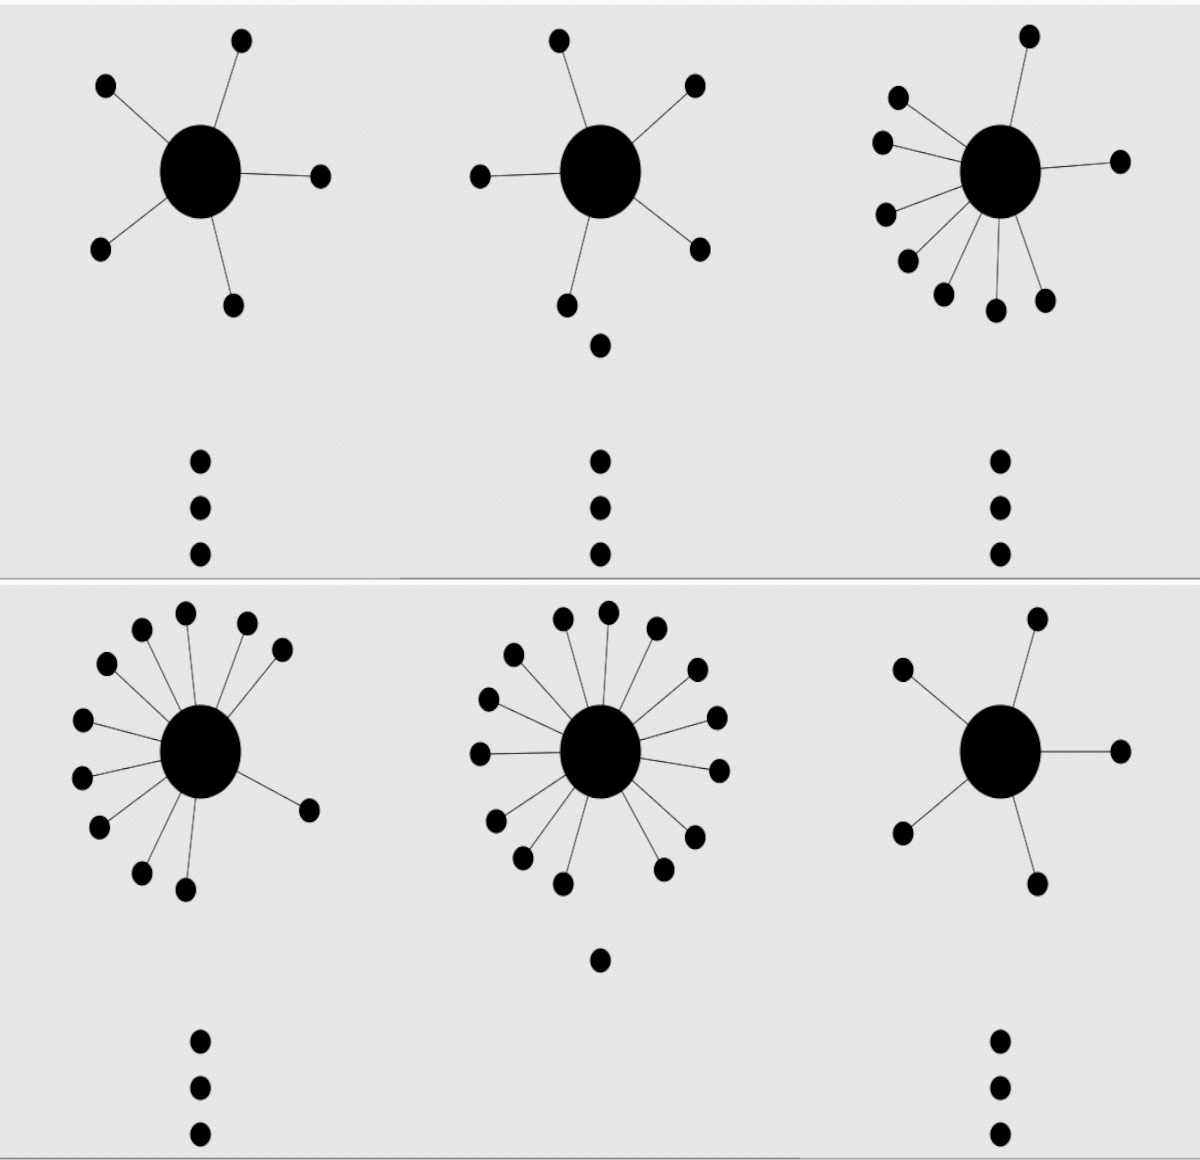
Aa

Made with p5.js

Snake

Made with Processing

MineSweeper

Made with p5.js

Pong

Made with Processing

Maze Gen/Solver

Made with Processing

Fluid Simulation

Made with Processing

Double Pendulum

Made with p5.js

Cube Wave

Made with p5.js

Spiral Circle

Made with p5.js

Spiral Circle 2

Made with Processing

Times Table

Made with p5.js

Fast Fourier Transform

Made with p5.js

Mouse Follower

Contact Me